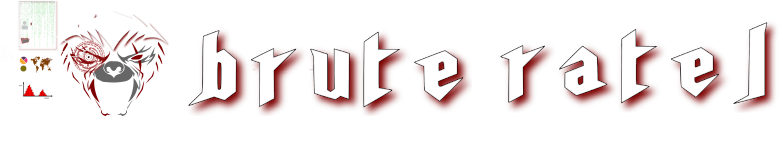
Brute Ratel v1.2 codename Scandinavian Defense is now available for download. The main highlight of this release is memory evasion and support for bringing in your own injection techniques via COFF. This release brings major improvements to the badger’s core, both staged and stageless thereby avoiding every EDR trap in memory. This release was tested against 17 different EDRs and Antiviruses prior to the release to detect and bypass all possible traps into memory. There are several major changes made to the sleep masking and dot net evasion techniques following the detection blog from MdSec on suspicious stack threads and dotnet execution detections. A quick summary of the changes can be found in the release notes. The below image shows some of the top tier EDRs which were tested against these techniques and evaded successfully in their highest prevention mode.
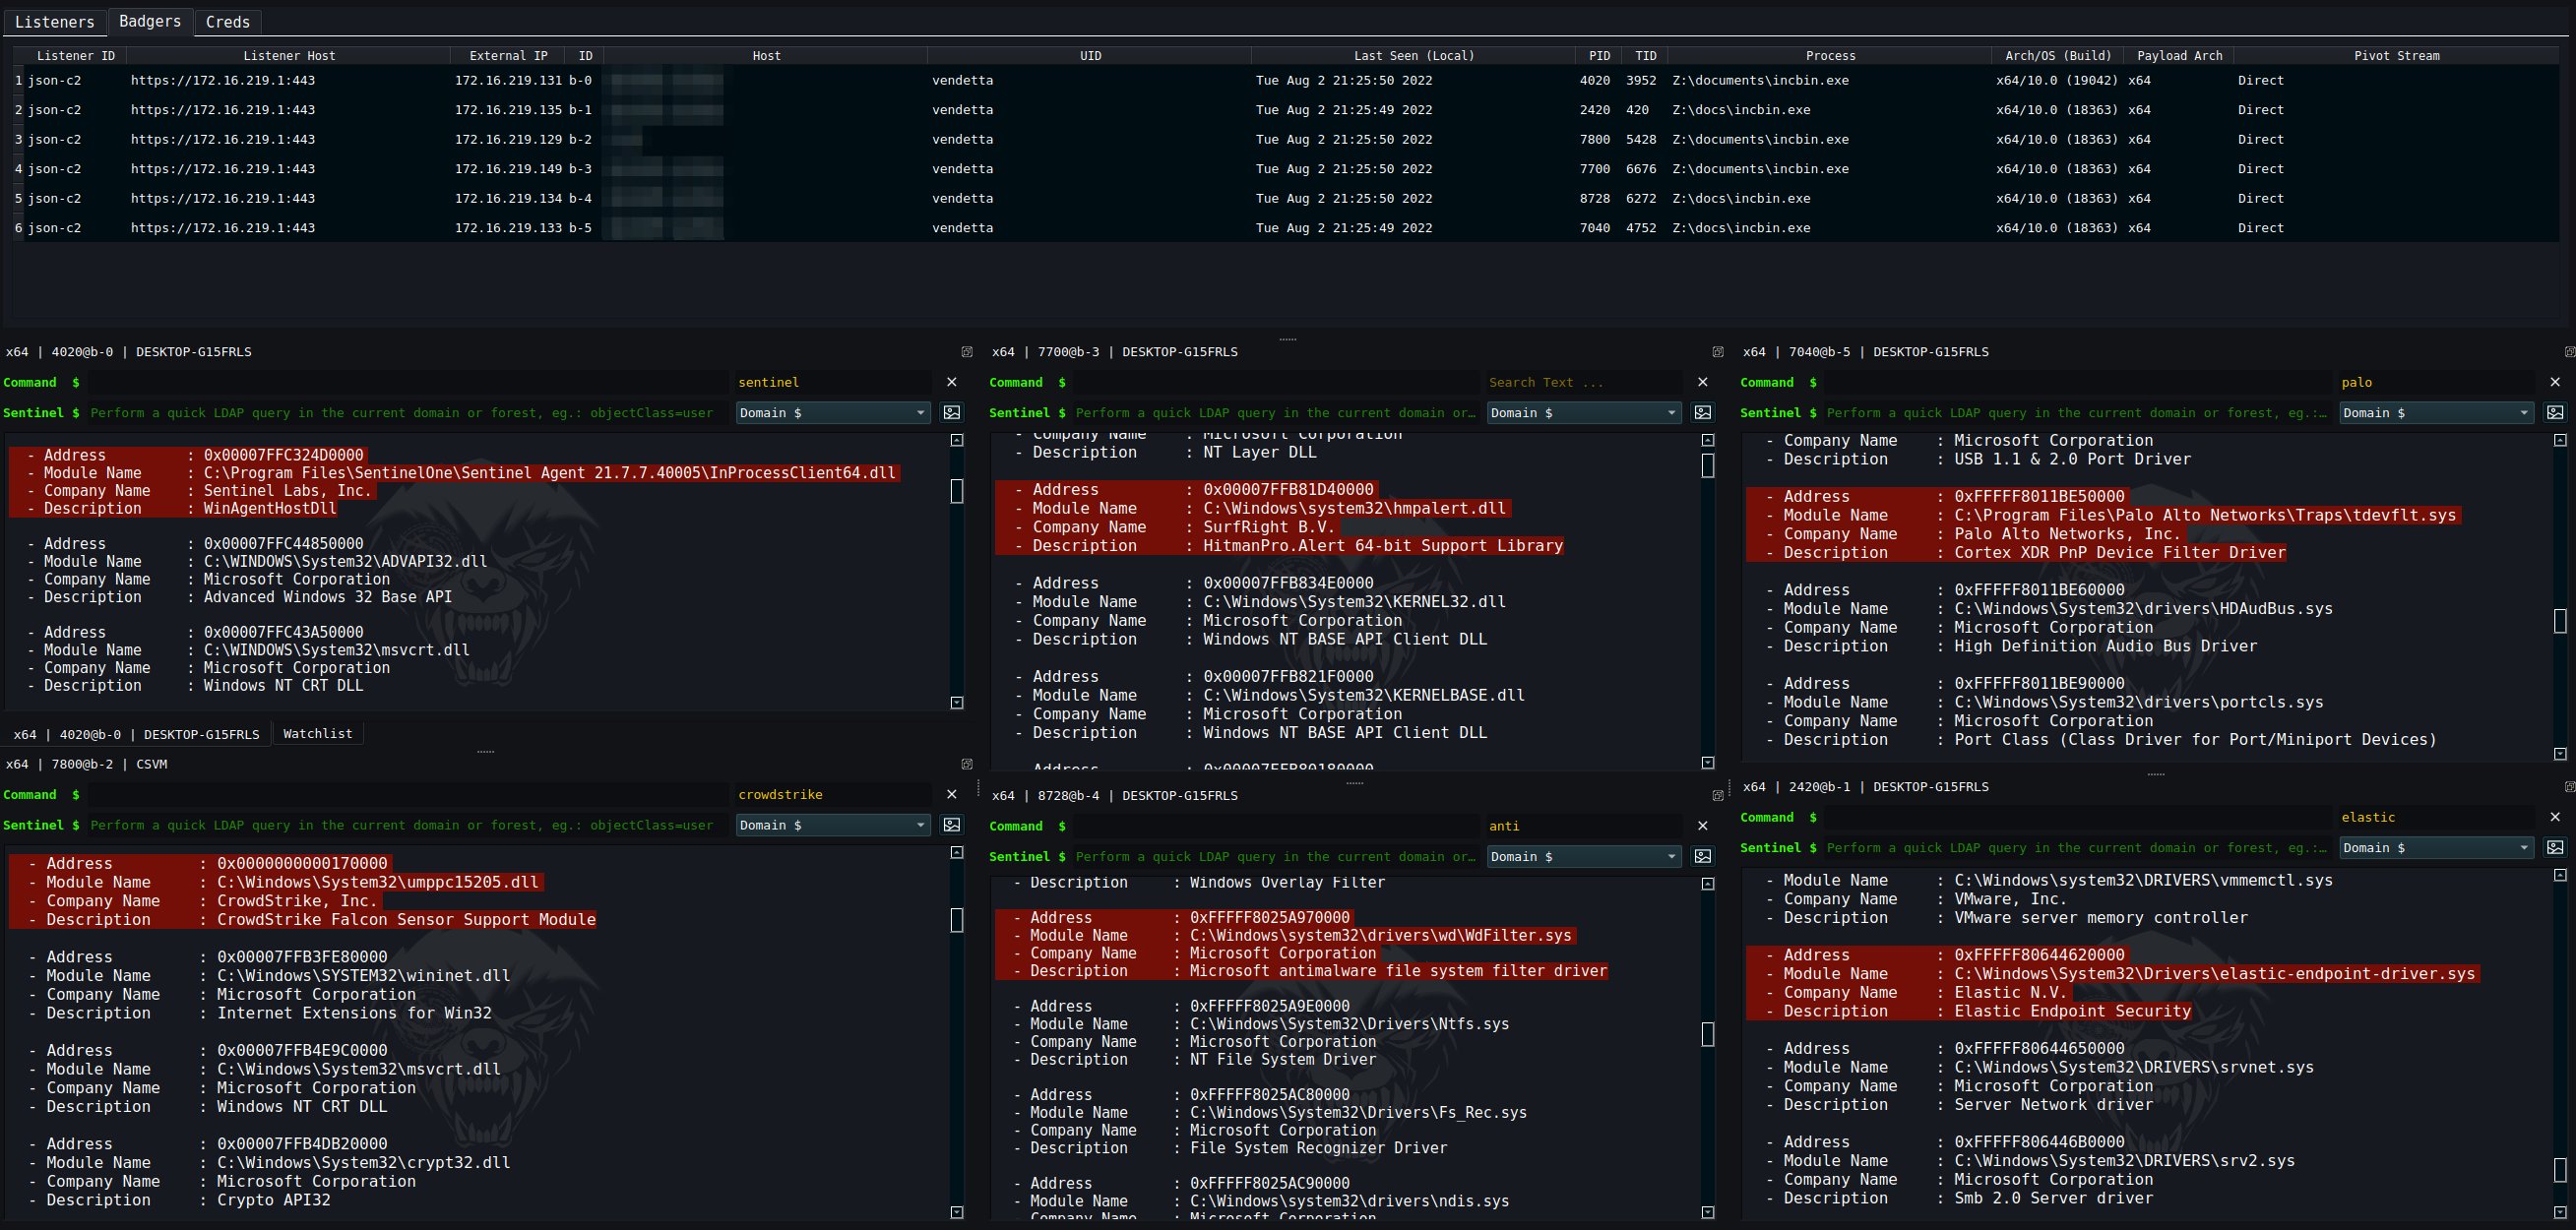
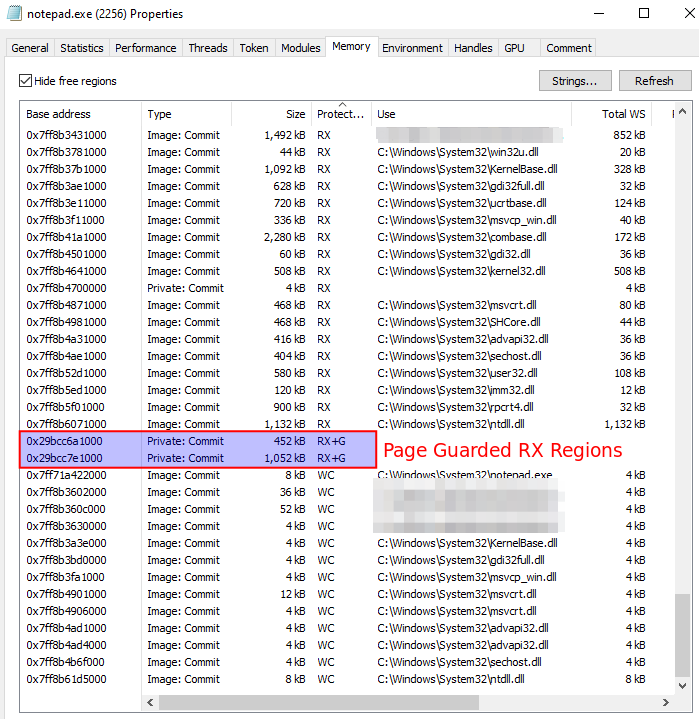
The term Scandinavian Defense originates from an opening in chess where the Black chess player performs a counter attack to avoid the initial traps set by the White player to control the center pieces of the game. This release was heavily inspired from this chess opening. The concept of EDRs work similar to that of a white player in Chess, where the white player can execute the first move and try to control where the game leads. EDRs in general have the same benefit of loading its userland DLL directly from the kernel on the first thread creation of a process and add traps to various locations in memory to control how the shellcode executes. Our main aim here is to avoid all the traps from the EDR and control the core of the process which resides in ntdll.dll. It was observed during research that some EDRs tend to hook the Process Environment Block (PEB), Import Address Tables and Export Address Tables of ntdll.dll, kernel32.dll and kernelbase.dll apart from the usual jump-based hooks in the RX region. Most shellcodes read the LDR_DATA_TABLE_ENTRY in the PEB to extract the base address of ntdll and kernel32. However, if the PEB is hooked, then the base addresses stored in this location would be different. Some EDRs map a custom RX region of kernel32 and ntdll in memory while enabling Page Guards on them, and the addresses for these manually mapped regions are written to the PEB. The moment a shellcode tries to read the PEB and hop on to the RX/EAT region of the dll, the shellcode lands into the Page Guarded region eventually raising an exception and this exception is caught by the EDR’s userland DLL using Vectored Exception Handler. Once the exception is caught, the userand DLL can check the registers and stack to identify where the call originated from and kill it instantly.
It was also observed that even though there are kernel callbacks to identify a DLL loaded into memory, some EDRs hook LdrLoadDll and LoadLibrary to check where the API call is originating from. If the originating region is from a user allocated RX/RWX region, the process would be eventually terminated after sending in the telemetry to the EDR’s console. Most generic reflective DLLs will basically be killed at this point which call LoadLibraryA to load Dlls into memory. Another minor issue here would be the trap from ETWTI sensors which can check the stack frame to identify where the call is originating from. If the call made to NTAPI with spoofed argument itself is originating from user allocated RX/RWX region, unbacked by a module on disk, that itself triggers an anomaly for certain EDRs capturing stack telemtry via ETWTI or even the userland hooks in this case. There is no known public technique which evades such detections simultaneously on userland and the kernel, however upon further research, it was observed that the EPROCESS block of a process actually stores various regions of ntdll.dll spread across into various structures. If one can find this region and it’s offset, it becomes extremely easy to find the legitimate ntdll’s base address into memory and then further utilize it to extract other metadata of ntdll, kernel32 and kernelbase. The EPROCESS information can be dumped from windbg in the kernel mode using kdextensions.
If all of the previously mentioned traps are bypassed, there still resides an issue of extracting the correct NTAPI function pointers from the EAT as the EAT of ntdll will also be hooked. Walking the EAT and extracting the function pointer leads down to a rabbit hole since all the original function pointers are overwritten with an address belonging to the Page Guarded region of the userland DLL, thus executing another hit to the trap. However, this can be evaded by unhooking the EDR’s dll before extracting information from the EAT.

Dumping the memory of hooked ntdll.dll from x64dbg to disk

Comparative analysis of hooked ntdll.dll v/s original ntdll's EAT
Another major detection of the badger was the way how the PIC bootstrapped itself into memory. The v1.1 release stopped the use of reflective DLLs, however there was still an issue of reallocation of the boostrapped stage/PE. This was only a problem with Elastic EDR where any execution of API from an unbacked DLL on disk was killed by Elastic. Badger by itself does not perform any module stomping and the v1.1 release of badger reallocated itself using the initially executed PIC. Upon reversing the Elastic’s kernel driver, it was observed that when you module stomp and execute the badger’s PIC, the detection from Elastic’s ETWTI sensors existed due to the fact that badger’s PIC reallocated itself to a new section which was unbacked.
The stageless ‘stealth’ shellcode of the badger and the staged shellcode, both starting from v1.2 unhook the EDR’s dll as well as use custom techniques to find the address of ntdll.dll into memory. Make note that the stealth shellcode only works on x64 versions of windows except on Server 2012. For this reason, the default version still exists which will still evade most traps on x86 and x64 except the unhooking of the DLL. Once the EDR’s DLL is unhooked, an operator should be able to use all NTAPI and WinAPI calls without having to worry about any hooks in the EAT or jump instructions in the RX region of the system DLLs. Another major update to evade the Elastic EDR detections were to change the way PIC gets executed into memory. In order to avoid this detection, badger now uses a fully custom PE compiled using a modded version of Mingw GCC Compiler which changes the way how the PE and it’s sections are generated. This means that the PIC will not allocate any new memory and resuse the existing one allocated by the operator to remap itself into memory which will still be backed by the operator’s stomped module. This technique wouldn’t have been possible with reflective DLL’s as that led to a loader lock. However, make note that only virtually allocated regions can be remapped. Memory regions mapped using NtMapViewOfSection do not allow remapping without unmapping first, and thus in this case there will still be another memory allocation by the badger. However, the operator doesn’t need to worry about this. The only care the operator has to take is to not unmap or erase the region they allocated themselves. This is due to the fact that starting from v1.2 release, badger takes care of it’s PIC as well as every memory which, the badger, or the operator allocates for it. There are several sample shellcode loaders provided in the package of Brute Ratel in the ‘adhoc_scripts/shellcode_loader_samples’ directory which can be used to generate custom sideloadable DLLs as well as the examples can be used as a reference to make changes to your own loader. This is also available on github Brute-Ratel-C4-Community-Kit.
Apart from the evasions, a few new antidebug techniques have been added to the badger to make it difficult to reverse engineer. This shouldn’t however be an issue for a skilled engineer who knows what to look for, however anyone who doesn’t have much experience with it, or threat hunters who don’t have much experience with anti-anti-debugging will find it hard to execute the payload inside a debugger. This techniques applies to default, staged and the stealth shellcodes. This feature was added to evade automated sandboxes which capture stack traces and strings by executing a payload in such environment. The badger is now configured to detect the presence of windbg, x64dbg, IDA Pro and crash itself if it finds the trap being hit. The below video shows a quick example of how the payload reacts when loaded in a debugger v/s when ran directly.
Badger encrypts all it’s PE sections by default and a selected set of heap allocations. However, the data stored on stack was still in cleartext in the v1.1 release. This usually isn’t a big deal unless someone manually inspects the strings on stack in the memory of process. Heap allocations aren’t hard to track, however it isn’t the same case with stack. Another issue with heap release was that whenever you free up a heap allocation, the windows heap manager only marks it as free and doesn’t zero it out. This data only gets erased when the same heap is used by some other code and it gets overwritten. This is by design, as zeroing out every heap allocation can significantly eat up the CPU time. And if you add Hardware hooks using Single Step Exception every now and then, the whole payload will be significantly slow which may not directly be visible to the naked eye, but anyone who opens up a task manager can see the high CPU usage by the payload. I wanted to find a way to avoid this whilst wanting to hide my heap as well as stack. However, with further research and thanks to the motivation that MdSec provided with it’s detections, I was able to find various ways to encrypt full heap and stack without the need for any hooks. All badger threads now use a custom heap for everything i.e. including the memory allocated by BOFs. This means when you allocate BOFs and erase them, they get zeroed down too. The stack is also encrypted for all threads when the payload goes to sleep, so no data on stack will be visible in this case. The below video provides a brief overview on stack and heap encryption.
Another detection from MdSec’s post was the detection of a hardcoded stack frame. This should work fine in most cases, but to an experienced threat hunter, this may look a bit suspicious. However, several changes have been made to the sleep masking mechanisms. The badger now, before going to sleep will enumerate threads in the current process, copy the stack to self and use it to spoof the current thread’s stack. This means anyone who takes a look at the stack, will always look at a valid stack, both on x86 and x64. The below video shows a quick overview of Thread Stack Frame Duplication.
COFF file provides a variety of ways to build your own tools for the badger. However, the coffexec command in Brute Ratel was limited to executing BOFs with text based command line arguments. There are several scenarios where you might want to bring in your own injection techniques during an assessment. Reading a shellcode, dotnet or a reflective DLL file from disk was not possible till v1.1 release. With this release, you can configure the COFF file based arguments using the set_coffargs command. This command allows an operator to load upto 10 files from disk and use them on the fly with the coffexec command. This command can also be used with the manual commandline args that a user provides to coffexec. Let’s say an operator reads two files from disk using the command ‘set_coffargs /root/shellcode1.bin /root/reflectiveDll2.bin’. Now when an operator executes coffexec, say ‘coffexec /root/mycoff.o someArg1 someArg2’, the first set of commandline arguments will always be the buffer of files read into memory followed by the commandline args provided by the operator. So, in short the actual commandline sent to the COFF file would be ‘coffexec shellcode1_buffer reflectiveDll2_buffer someArg1 someArg2’. This way you can bring in your own COFF injection techniques to the game without having to embed your shellcode and DLL buffers as unsigned char arrays into the BOF. Due to this feature, it was also important to provide an option to the operator to fetch the size of the buffer as it will be needed to allocate memory into local or remote process. For this reason, the BadgerGetBufferSize API is introduced to this release which can take a buffer and return you the size of the buffer in memory for further use such as memory allocation and protection changes. The below video should give a brief overview of hows this works and the sample BOF injection templates are added to the server_confs/bofs directory in the Brute Ratel package.
Another highlight of this release is the use of hardware breakpoint to perform patchless hooks to EtwEventWrite and AmsiScanBuffer. This was also highlighted in the MdSec blog which talks about detecting patched memory instructions such as the ‘ret’ instruction on EtwEventWrite and AmsiScanBuffer. Hardware hooks are not new and a very common practice in the gaming community for Cheatengines which have been active since 2015 or so. Several blogs and POC code on applying hardware hooks can be found in the unknowncheats website. Hardware breakpoints work by adding an address into the debug register (Dr0-Dr3) and enabling the bits in the Dr7 registers. Now whenever this address is hit, a SINGLE_STEP_EXCEPTION is raised which is caught by the Vectored Exception Handler and returns your VEH Handler with the CONTEXT of the thread which has hit the breakpoint. This CONTEXT can be modifed as per the operator’s choice. Using VEH over and over again is a bad software development practice because SINGLE_STEP_EXCEPTION eat up a lot of CPU time. Another important opsec consideration is to disable or clear the debug registers as soon as the task is complete. The Nighthawk C2 keeps it active forever, as they hook everything using hardware hooks, especially process heap. Since the process heaps are utilized every now and then, the hardware breakpoints are active all the time to capture and reroute them. The issue here is, if the hooks are active all the time, a threat hunter can simply run GetThreadContext on all threads of a process and check if the debug register is set on any thread. If they are, then it is sure shot malicious which is a really big IOC, because no legitimate programs actually use hardware breakpoints. Another reason to not keep hardware hooks active all time is because of the heavy CPU utilization as you are single stepping every instruction. However, in case of badger, the hardware hooks are crafted extremely carefully to only enable them just before the assembly is loaded. The debug registers are cleared as soon as the assembly is unloaded and the VEH is removed. The below video provides a brief explanation of the use of Hardware breakpoints for evading detections on dotnet execution.
The v0.8 relase of Brute Ratel introduced webhooks to forward either a copy of badger’s initial connection or the whole output of badger to another web server. I received a lot of requests to demo how I usually use the webhooks for notifications on new badger connections, and thus I decided to release the small python3 script I use to capture the event forwarded from the Brute Ratel’s webhook and forward it to the Slack. This should be pretty straight forward and the below video explains the process for that. The python3 script is also available on github Brute-Ratel-C4-Community-Kit.
Apart from the core changes above, there are several minor changes to the payload which are listed down in bullet points
On a final note, I would like to highlight that Dark Vortex has officially hired Dom Chell from MdSec to vet the product for any possible detections and report back, so as to help us improve the product, as it has been done for the last two releases. Special thanks to MdSec and team. I would like to conclude the blog by saying that heavy research went into this release to evade several kernel and userland detections and there are few more unique techniques that will be available in the upcoming versions of Brute Ratel. Stay Tuned!!